Overview
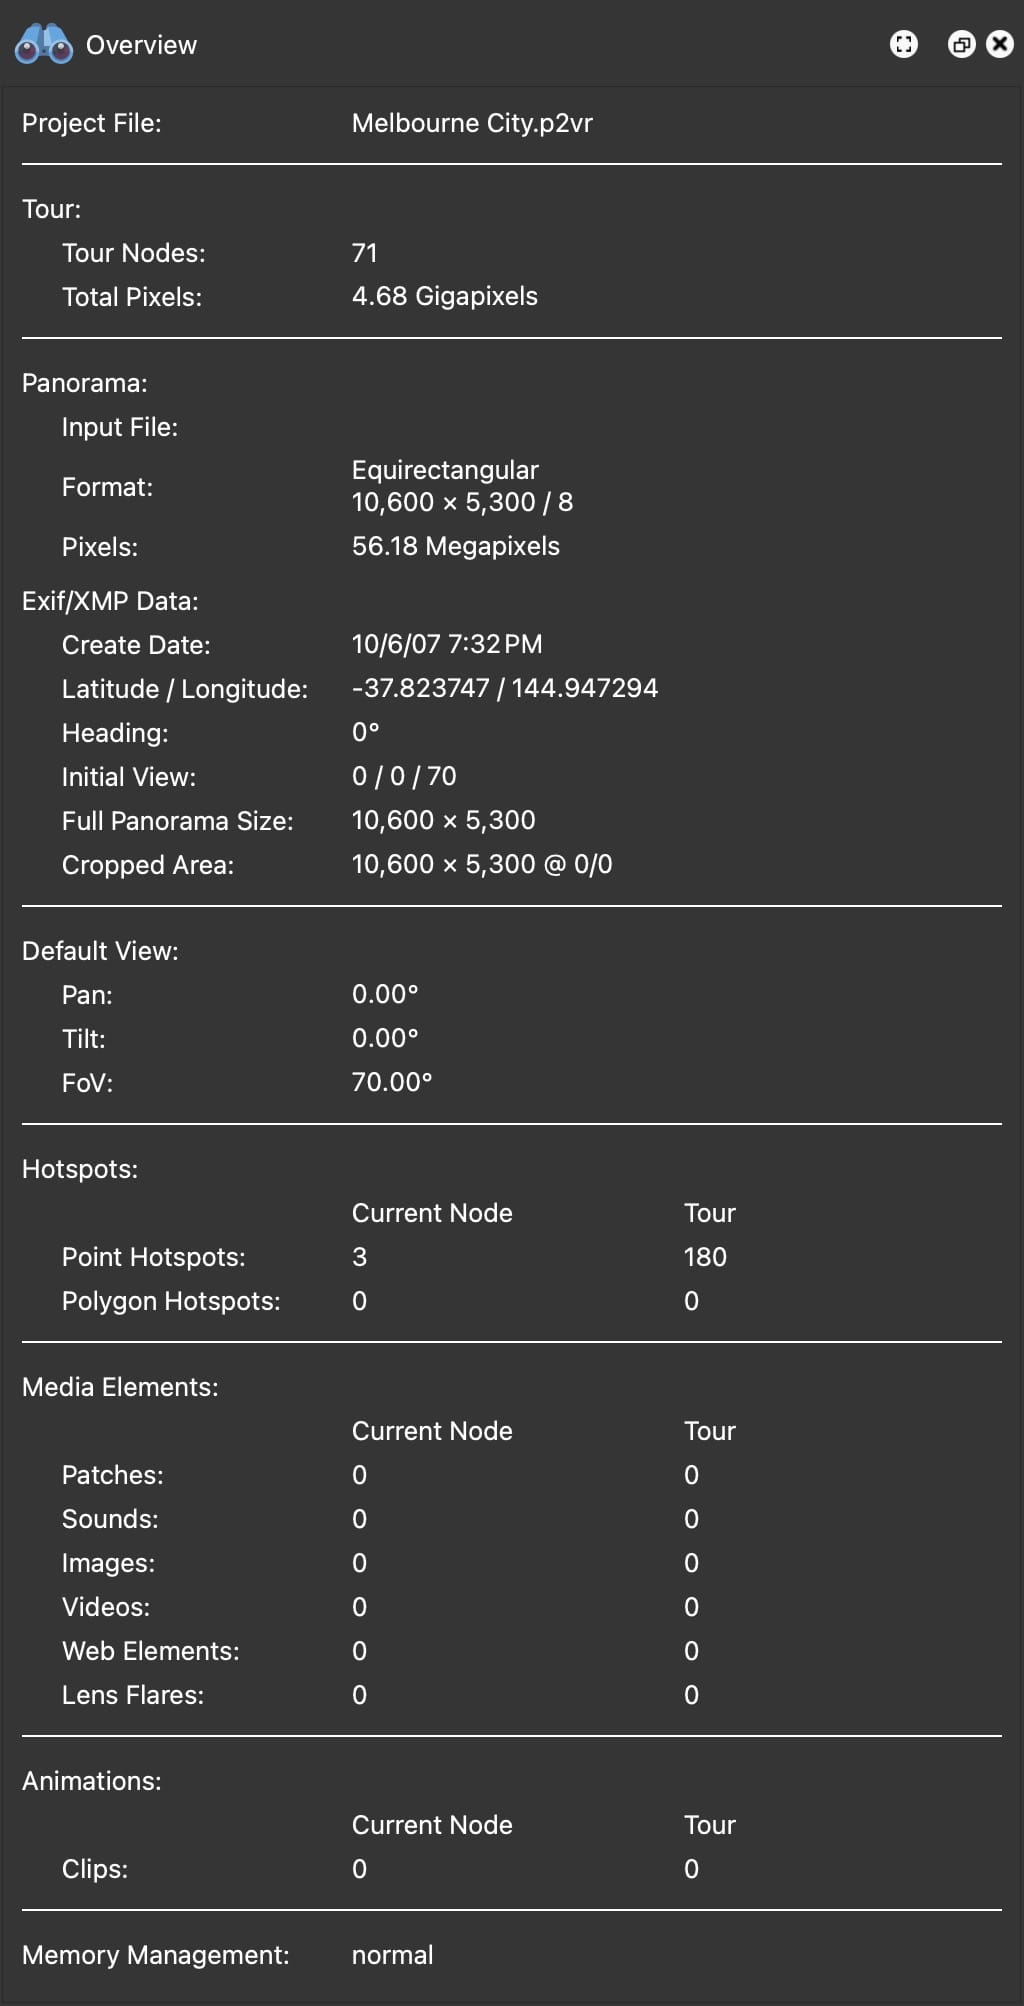
The Overview panel sums up the project and the current node, from input files and metadata to hotspots, media, tags, and how Pano2VR is using memory.
The Overview panel displays the following:
- The project file’s name
- The number of nodes in the tour, how many of them pass the Tour Browser filter, and how many are selected, plus the total pixels of the project
- Information about the current node (file name, format, pixels, Exif/XMP data, ICC profile)
- The current node’s default view (pan, tilt, FoV)
- Hotspots (point and polygon hotspots)
- Media elements (patches, sounds, images, videos, web elements, lens flares)
- Animations (clips)
- The tags and auto tags used in the tour, with the number of nodes that carry each one
- Memory Management
With more than one node in the project, the panel shows a column for the current node and one for the whole tour.
Tags – Click a tag to filter the Tour Browser for it. A second click inverts the filter, so it shows the nodes without that tag, and a third click removes the filter.
Memory Management
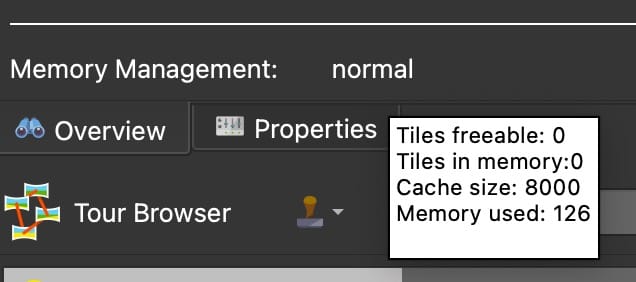
Memory Management shows how Pano2VR is handling the memory for your images. Hover the pointer over the message to see more figures: the number of tiles in memory, how many of them can be freed, the cache size, and the memory used.
- normal – Memory use is well below the Memory Size Hint set in the Settings.
- dumping to disk – Memory use is getting close to the Memory Size Hint, so Pano2VR is moving image tiles out to the image cache on disk.
- full – Memory use has passed the Memory Size Hint. Pano2VR frees memory right away and briefly holds back loading new tiles until there is room.
If you often see dumping to disk or full while you work, and your computer has memory to spare, increase the Memory Size Hint.
Tile Cache Performance
Click the button next to Memory Management to open the Tile Cache Performance window. It shows live graphs of how Pano2VR is using memory and the image cache:
- Image Pools / Waits – How busy the working threads are, and when they wait for reading or writing tiles.
- Cache Usage – Memory use as a percentage of the Memory Size Hint. Markers show when Pano2VR cleaned up memory by itself or when you purged the cache.
- Tiles – The number of image tiles held in memory, the ones that could be freed, and the ones stored on disk.
- Tile I/O Throughput – How fast tiles are read, written, and loaded on demand, with a line for each cache file (solid for reading, dashed for writing).
Below the graphs, the window lists how long reading, writing, and loading tiles takes, and, under Cache Files, the size, read and write speed, and queue of each cache file. Hover over a cache file to see its path.
This is mainly a diagnosis tool for large projects. If Pano2VR feels slow or memory keeps running full, the graphs show whether the Memory Size Hint is too small or the drive holding the cache files is too slow.
- Choose how much time the graphs cover: 1s, 5s, 1m (the default), or 5m.
- Select Stay always on top to keep the window in front while you work.
- Click Purge Cache to write the image data that isn’t needed right now to the cache files and free it from memory.
- Click Save Log… to export the collected data as a CSV file, for example to send to support. The log holds up to the last 10 minutes, whichever time range the graphs show.
3D Model Nodes
When the current node is a 3D model, the panel replaces the panorama information with a 3D Model tree. It shows the model data (input file, position, rotation, the model transformation’s position, orientation, and scale, the scale, and the number of splats for Gaussian splat models) as well as the model’s object names, animations, and variants. Right-click an object, animation, or variant and choose Copy Text to copy its name to the clipboard, for example to use it as a proxy ID in a skin.Examples
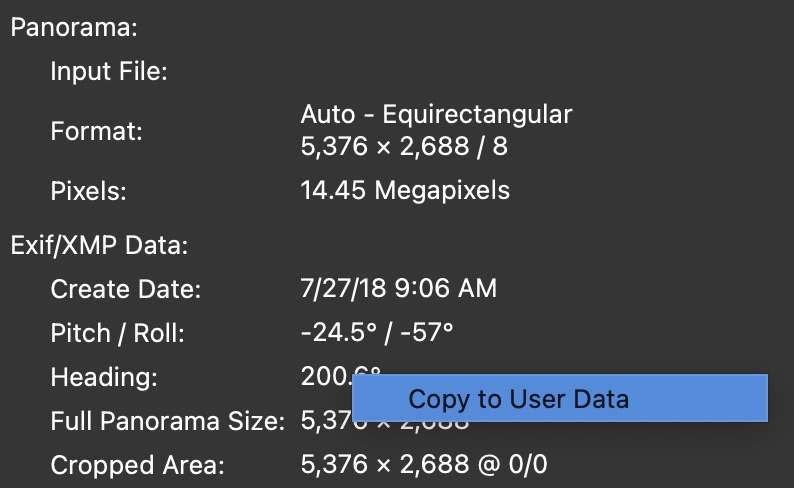
This is an example of a single node overview:
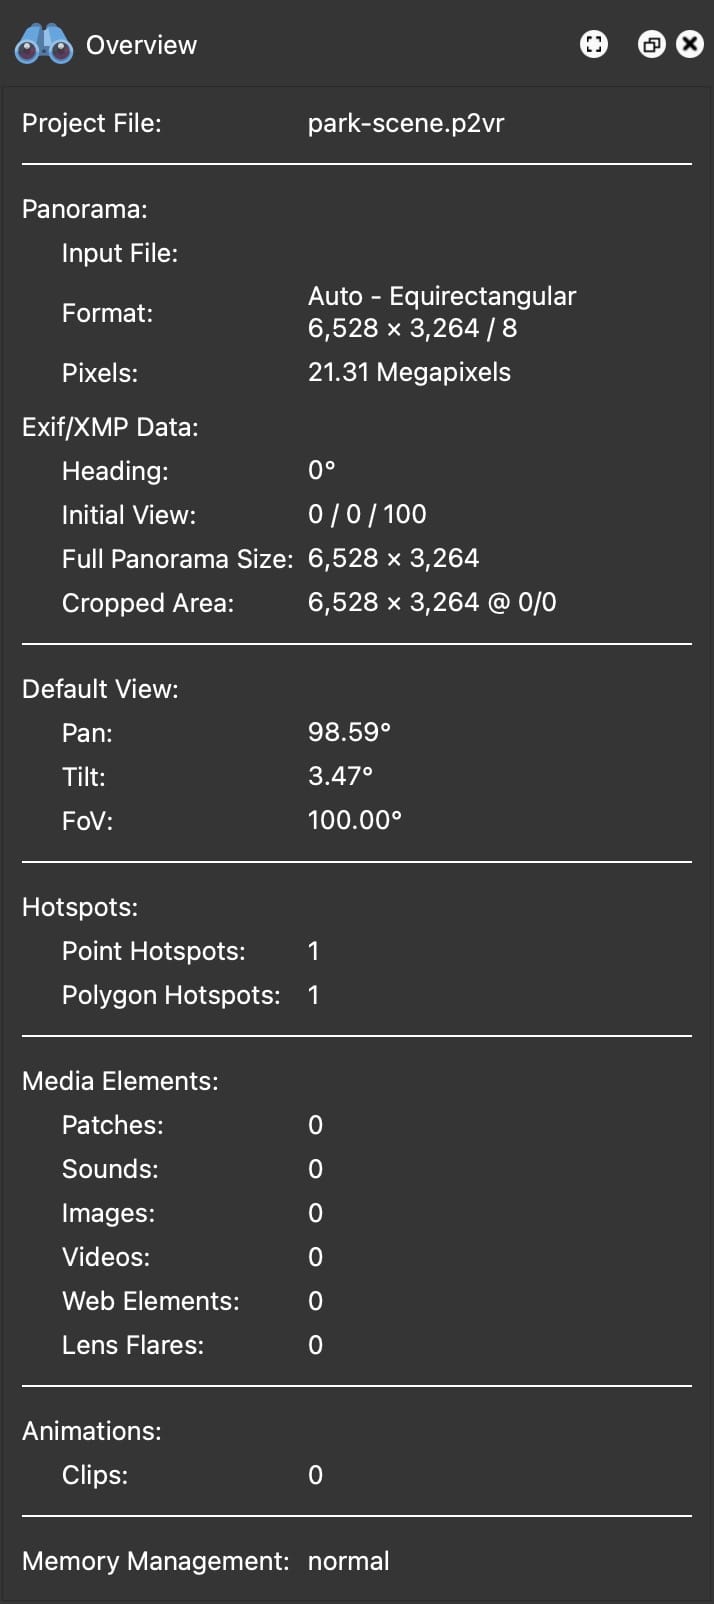
This is what a multi-node project with media would look like: